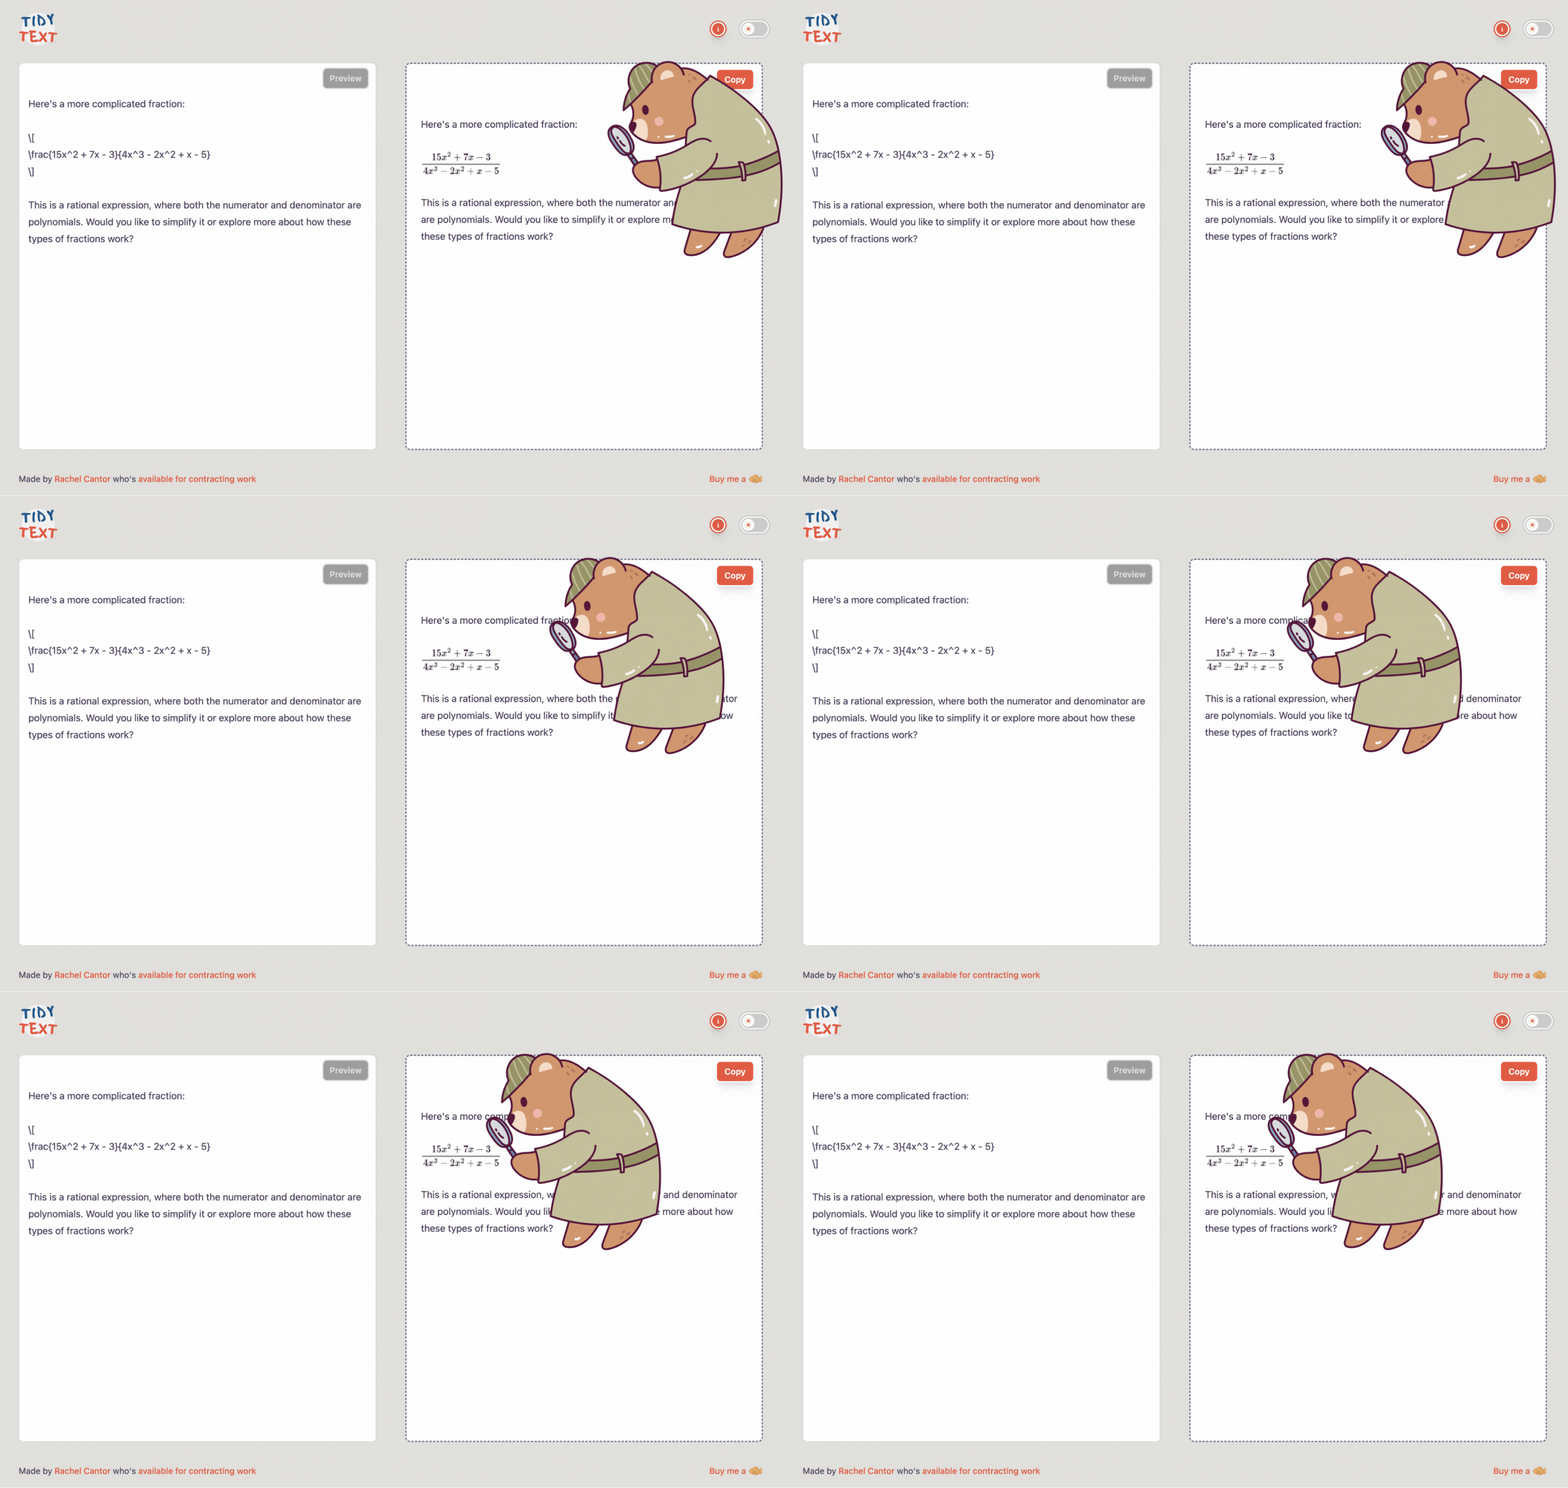
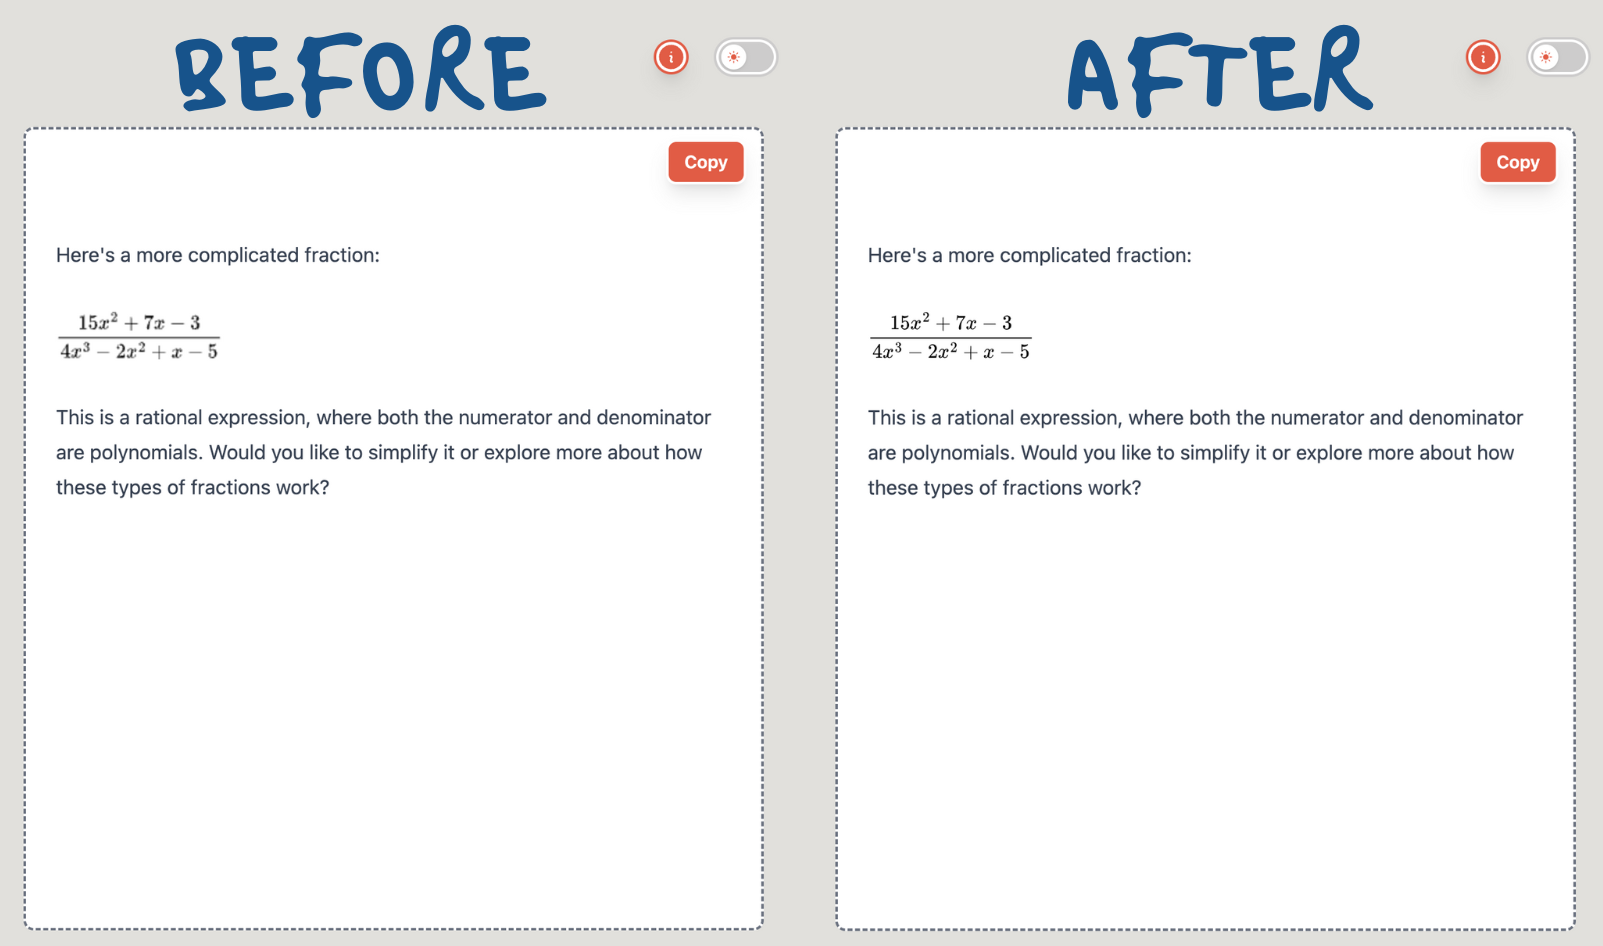
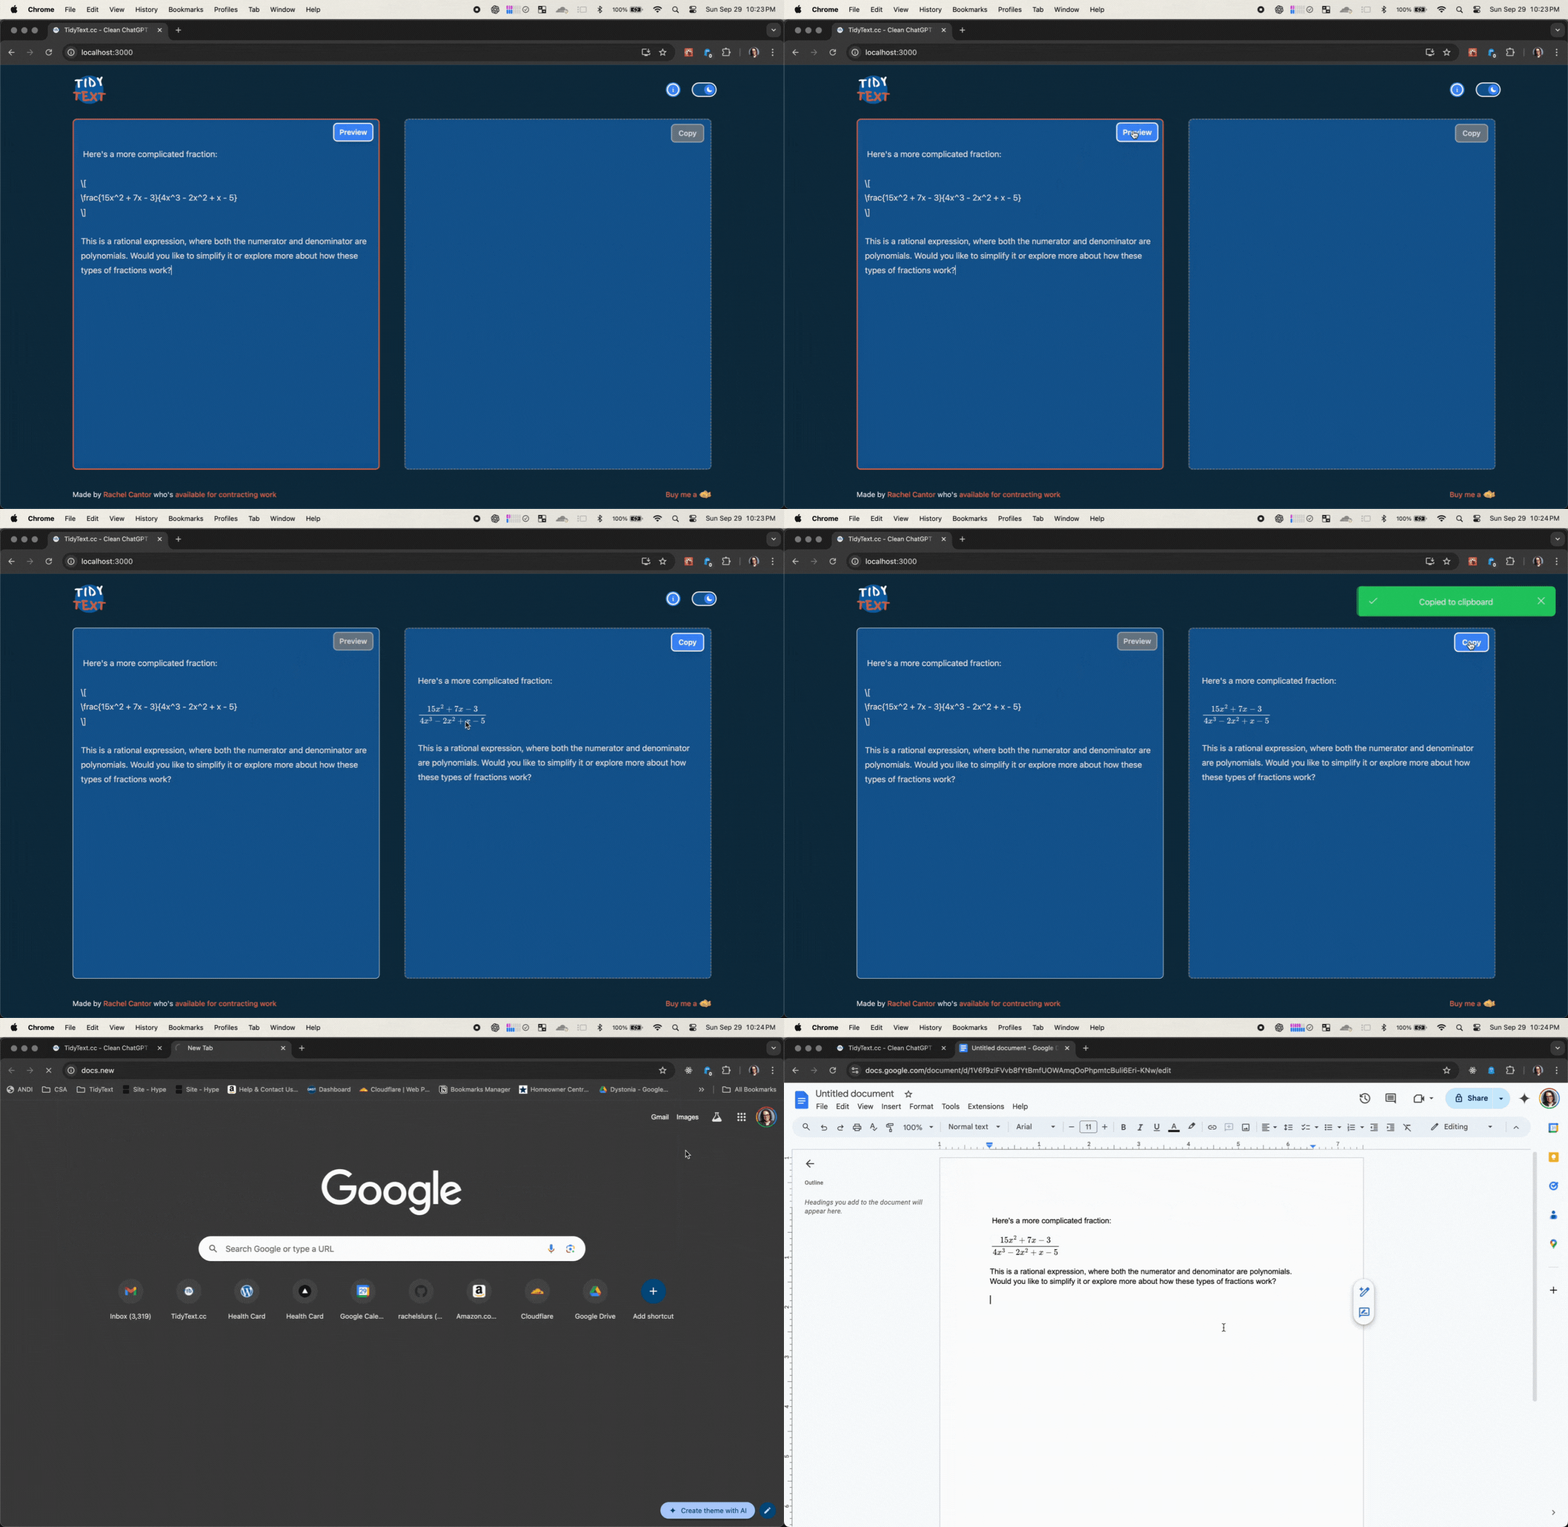
TidyText.cc, copy paste to Google Docs, now with support for fractions
I’ve been crowdsourcing feedback on my new app, TidyText, via Reddit. Since I don’t have Microsoft Word, I decided to share it there to get feedback on how well it works (or doesn’t work). The first comment I received pointed out that fractions weren’t supported. I hadn’t really needed to render fractions in HTML before, aside from using basic tags like <sup>, but since ChatGPT outputs fractions using LaTeX syntax, it seemed doable.
Attempt 1: Marked.js with KaTeX
I use Marked.js for converting Markdown to HTML, I figured there was an extension that might meet my needs. I foundmarked-katex-extension, but soon after, I realized LaTeX does not render properly in Google Docs without using add-ons. That’s when I thought, “Maybe I should generate an image, like an SVG, so it would be lossless.” But then realized that KaTeX doesn’t support SVG.
This led me to use MathJax, which felt like overkill at first, but since it supports SVG, it turned out to be the necessary choice.
Attempt 2: MathJax
After the markdown attempt failed, I pivoted to MathJax to convert LaTeX into SVGs. The idea was that I could render the fractions as vector graphics and paste them into Google Docs. At least, that was the theory.
The integration with MathJax was relatively smooth, and I was able to generate SVG images for the fractions, which looked great on TidyText. But there was another problem: SVGs didn’t render in Google Docs.
The solution worked well visually within the app but fell short in Google Docs.
Attempt 3: Using Canvas API to convert the SVG to PNG
Since SVGs wouldn’t render in Google Docs, I ended up thinking about using the Canvas API to convert the SVG to a format that could be pasted in Google Docs. I wanted something that wouldn’t look compressed, so I ended up deciding on PNG (as opposed to JPEG). I ended up creating it at first and testing it out only to notice the resulting PNG images were blurry.

I realized that I could scale up the image and then scale it back down in order to generate something that would appear extra crispy.
const img = new Image();
img.src = "data:image/svg+xml;base64," + btoa(svg);
img.onload = () => {
  const scaleFactor = 3;
  const canvas = document.createElement("canvas");
  const ctx = canvas.getContext("2d");
  if (!ctx) return;

  canvas.width = img.width * scaleFactor;
  canvas.height = img.height * scaleFactor;
  ctx.scale(scaleFactor, scaleFactor);
  ctx.drawImage(img, 0, 0, img.width, img.height);

  // Convert canvas to PNG data URL
  const pngDataUrl = canvas.toDataURL("image/png");
  const imageTag = `<img src="${pngDataUrl}" alt="LaTeX formula" style="width:${img.width}px; height:${img.height}px;" />`;
};

I then tested it using dark mode and noticed given these are images, the text needed to appear to be white, even though when copying to Google Docs, we’d want them to be black, so I decided to use the TailwindCSS dark mode variant to use a CSS filter to invert the text, that would then not carry over in the copied version.

TailwindCSS offers the filter invert and we can prepend it with dark: like so:
const imageTag = `<img class=“dark:invert” id=”${uniqueId}” src=”${pngDataUrl}” alt=“LaTeX formula” style=“width:${img.width}px; height:${img.height}px;” />`;

I did notice fractions don’t work in tables yet. Something for another day.
TLDR; Lessons learned
- Markdown and LaTeX: not supported by Google Docs
- MathJax: good for rendering formulas in SVGs
- SVGs don’t render in Google Docs
- Canvas API for SVG -> PNG conversion with scaling to keep text extra crispy.
- CSS dark mode: being able to dynamically invert the image without affecting what the fraction would look like in Google Docs.
Next on the roadmap
Next on the roadmap (I think) is one-click Google Docs integration, but waiting on people to use the app and give feedback on features they actually want vs features I think they want, but really, I want. 🤓 🤪
-
Tags:
- markdown
- mathjax
- canvas-api
- tidytext